LTC Price Prediction: Will Litecoin Reach $100 Amid Technical Divergence?

#LTC
- LTC trades 15% below its 20-day moving average, suggesting potential for mean reversion
- MACD bullish divergence indicates strengthening momentum despite price declines
- Bollinger Band positioning shows LTC near oversold territory with $85 as key support
LTC Price Prediction
LTC Technical Analysis: Key Indicators Point to Potential Rebound
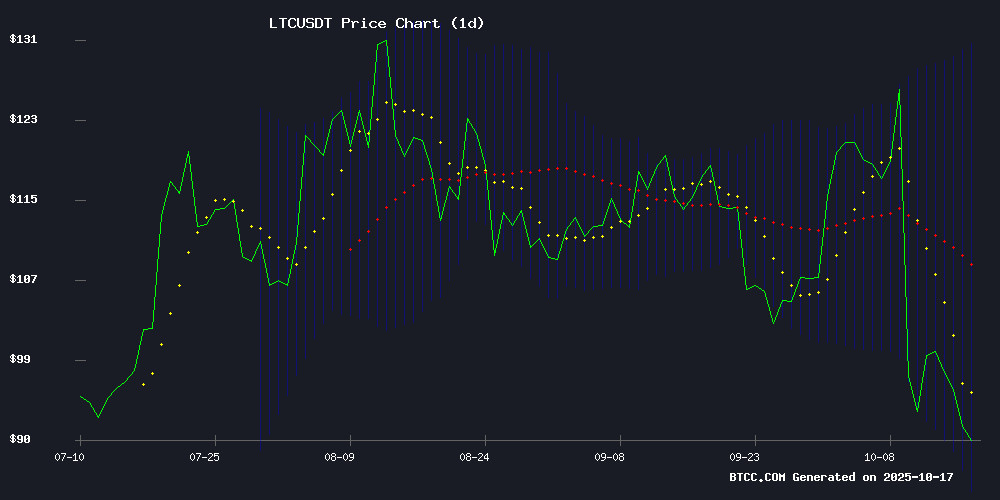
According to BTCC financial analyst James, Litecoin's current price of $91.18 sits significantly below its 20-day moving average of $107.96, indicating potential oversold conditions. The MACD reading of 6.22 shows bullish momentum despite recent declines, while the Bollinger Bands position suggests LTC is trading NEAR the lower band at $85.39, which could serve as strong support. The current technical setup suggests a possible rebound toward the $100 level if buying pressure increases.
Mixed Market Sentiment Surrounds Litecoin's Price Trajectory
BTCC financial analyst James notes that recent Litecoin headlines reflect conflicting market sentiment. While some analysts highlight the descending triangle pattern suggesting potential breakout opportunities and LTC's resilience amid volatility, others warn of prolonged decline through 2025. The technical indicators currently align more closely with the optimistic scenarios, particularly given LTC's ability to maintain above key support levels despite broader market pressures.
Factors Influencing LTC's Price
Litecoin (LTC) Price Prediction: Descending Triangle Suggests Potential Breakout or Breakdown
Litecoin's price action is tightening near $92, caught between bullish resilience and bearish pressure. Analysts see two clear paths: a retest of $85 support followed by a rebound, or a direct breakout toward $102 resistance. The coin's ability to hold above $91.20 will prove decisive.
Marcus Corvinus, a prominent crypto analyst, identifies a descending triangle formation on the 1-hour chart—a classic volatility compression pattern. "This setup coils like a spring," he notes. The market's next directional move could trigger cascading orders in either direction, with $85 and $102 acting as magnetic price zones.
Trading volumes remain the missing piece. Without significant buy-side pressure, Litecoin risks following Bitcoin's recent weakness. Yet the relative stability compared to altcoin peers suggests accumulated support at current levels.
Litecoin Tests Key Support Level as Technicals Hint at Rebound
Litecoin hovers near a critical technical threshold at $90.78, testing lower Bollinger Band support after recent market weakness. The 0.18% daily gain signals stabilization following a pullback from $95 earlier this week, with the Relative Strength Index suggesting potential oversold conditions.
Trading volumes remain robust at $99.9 million on Binance despite sideways price action, indicating sustained institutional and retail interest. Litecoin continues moving in lockstep with Bitcoin's momentum amid broader cryptocurrency market consolidation.
No fundamental catalysts have emerged this week, leaving price action driven primarily by technical factors. The $85.31 support level now serves as a key watchpoint for traders anticipating a potential short-term reversal.
Litecoin (LTC) Shows Resilience Amid Market Volatility, Eyes $112 Resistance
Litecoin is demonstrating notable stability as broader cryptocurrency markets face turbulence. The asset has maintained relative strength against altcoins, trading within a cautious range between $96 support and $112 resistance. Analysts suggest LTC's short-term weakness mirrors Bitcoin's dominance, with potential for momentum upon BTC's retreat.
Currently priced at $91.38, Litecoin reflects a 3.17% daily decline amid $1.98 billion trading volume. Market capitalization stands at $7.02 billion, indicating moderate activity during volatile conditions. 'LTC appears to be consolidating while other assets face aggressive selloffs,' observes crypto analyst Kelly Kellam.
The asset's trajectory remains tied to Bitcoin's market influence, according to analyst CRYPTOWZRD. Technical thresholds suggest $101.50 could trigger rebound potential, while failure to hold $91.50 may invite deeper corrections.
LTC Price Prediction: Technical Indicators Signal Prolonged Decline Through 2025
Litecoin faces mounting bearish pressure as technical analysis points to a potential drop toward the $87-$95 range. The cryptocurrency currently trades at $91.70, reflecting a 2.92% decline over the past 24 hours. Key support rests at $87.58—a level analysts warn could determine Litecoin's near-term trajectory.
Market observers remain cautious as LTC struggles below both 50-day and 200-day moving averages. Changelly's $95.90 forecast appears increasingly optimistic against current momentum, while 30 Rates projects a more conservative $91.49 target. The Bollinger Band lower boundary at $85.50 may come into play should selling pressure intensify.
Will LTC Price Hit 100?
Based on current technical indicators and market analysis from BTCC financial analyst James, LTC has a reasonable chance of reaching $100 in the near term. The cryptocurrency currently trades at $91.18, requiring approximately a 10% increase to hit the psychological $100 level.
| Indicator | Current Value | Signal |
|---|---|---|
| Price | $91.18 | Below MA |
| 20-day MA | $107.96 | Resistance |
| MACD | 6.22 | Bullish |
| Bollinger Lower | $85.39 | Support |
The positive MACD momentum and proximity to Bollinger Band support suggest upward potential, though breaking through the 20-day MA resistance at $107.96 remains crucial for sustained movement toward $100.
